Mini-lesson of the day:
Pool your data.
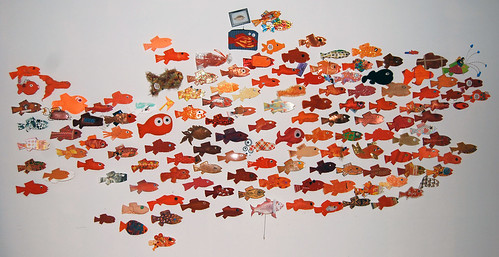
 This goes well as a pun with my one-of-a-kind hand-sewn fish swimsuit seller, so let's go back to her. It turns out, she's not the only one on Etsy selling fish swimsuits. Of course, no one else's fish swimsuits are exactly like her fish swimsuits, but there's a school of sellers around and they've even started a team called Team Swimmy Suit. They want to pool their data because some girl with a blog told them that was a good idea, but they don't know what this means or how to do it.
Here's how to do it.
Make a spreadsheet. Google Docs is wonderful for this because you can create a single online spreadsheet that everybody is allowed to edit, either by invitation only or by making it open access.
On that spreadsheet, you want to make places to enter the date the item sold, the price for which the item sold (how you want to deal with shipping is up to you, but I like to give it its own column), and the very general type of item. (Oh, dear lord, she made an example!) For fish bathing suits, the team might decide to split it up into small, medium, and large with columns for one-piece versus two-piece and extra places to check-off special characteristics that might effect the price, like custom, recycled, or jewel-encrusted. (Team SwimmySuit example. No, I really didn't have time for this.)
Then, you want as many people as possible to fill in as many sales as possible. The more data you have, the better your pricing info will be. Lucky for everybody, it doesn't matter if you haven't been keeping track of your sales thus far, since Etsy does it for you on your sold orders page. In theory, everything you need to fill out a spreadsheet should be there: date sold, price (with shipping separate), and what the thing was.
When you have a lot of data, it's time to analyze. It's up to you what constitutes a lot...How frequently do these items sell and how many people sell them and how wide is the range of what's out there? Fish bathing suits may be less common than felted boogers may be less common than beaded earrings. You know your craft. Just keep collecting data after you've started analyzing, too.
Hopefully, someone on your team has taken stats 101. If not, find out if someone on your team is sleeping with someone who has taken stats 101, or is the parent of someone who has taken stats 101. If that, too fails, pay someone like me to do it.
The easiest and most useful stuff for you to learn from the little exercise is how many fish swimsuits sold over time for each price range.
 That's the info you can then use to decide where to price your own items at the real true "bestish" pricing point, or at least the closest thing you're ever going to get to it.
You'll also want to pull out of your data pool analysis whether or not your extra column check boxes had any effect on the price. There's shmancy stats things you can do involving "r squared" and other crap, or you can just tell the spreadsheet software to do certain things if a column has a certain answer in it and see if the final totals change (which is why I no longer remember any formulas I learned in stats or econometrics).
A good stats-knowing person will look at the data in a whole bunch of different ways and see what sorts of other useful things pop out, too. Holiday trends, time trends, if a certain user's items always sell for significantly more or less than other people's and taking them out makes the rest of the numbers make more sense, etc. I'm too ADDesque to do this crap all the time, but I do find it interesting in short spurts.
In the end, even with all this wonderful information, your pricing will still be up to you. It will never be perfect and will more likely be a range than a number, plus people may hold onto "people pay more for recycled fish swimsuits" like a superstition even if the data proves otherwise. But if you make something even vaguely homogeneous with a team, jump into the pool. It can't hurt.

No comments:
Post a Comment